
Integration Guide
ESO NERIS
Connect your ESO NERIS data to your First Arriving dashboards and put live call volume, response-time performance, incomplete reports, and recent incidents on the screens in your stations — no manual entry, no exporting spreadsheets.
What we can put on your dashboard
Once your ESO NERIS subscription key is connected, you can add any of the following widgets to any dashboard, as many times as you like, each with its own settings. Ten widgets are available today across four formats:
5 Tables
Roster and run data
Call counts, calls by type, turnout times, incomplete reports, and a running list of recent incidents.
2 Charts
Visual breakdowns
Incident and call volume as doughnut or bar charts, grouped however you want to see it.
1 Gauge
Performance at a glance
A single response-time metric on a radial dial, measured against your benchmark.
1 Map
Recent calls, plotted
Your latest incidents dropped as pins, with the detail you choose in each popup.
About date ranges: every widget pulls the last 30 days by default. You can set any window from 1 to 365 days, except the Recent Calls Map, which is capped at 30 days.
Example screens
A few of these widgets on a First Arriving dashboard.
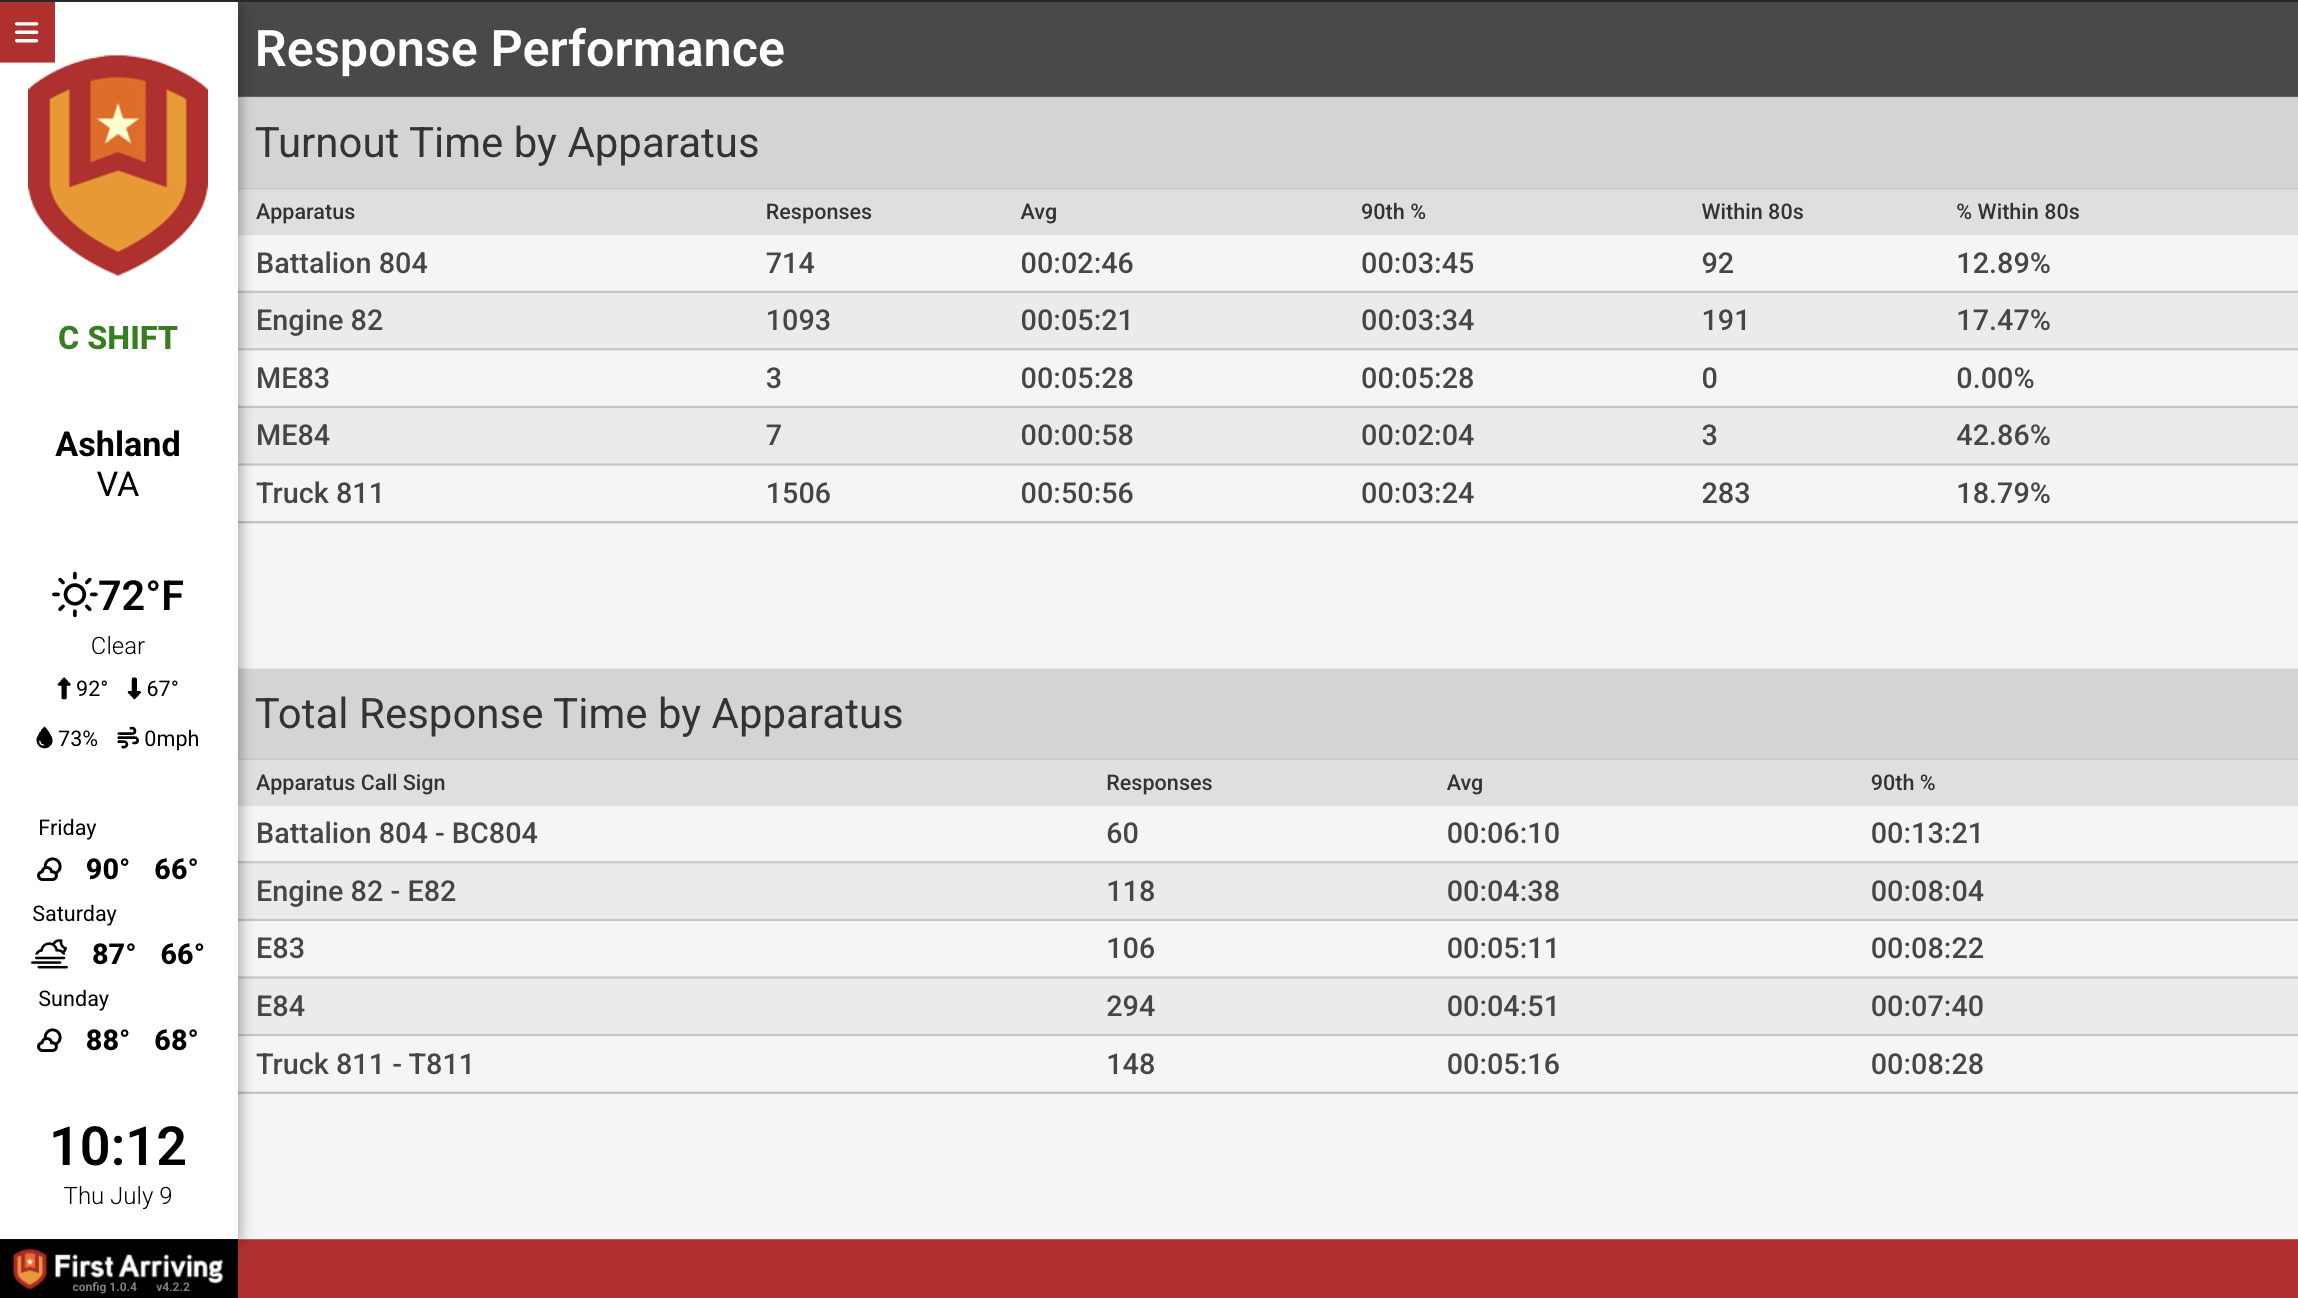
Turnout Times and total response-time tables, side by side.
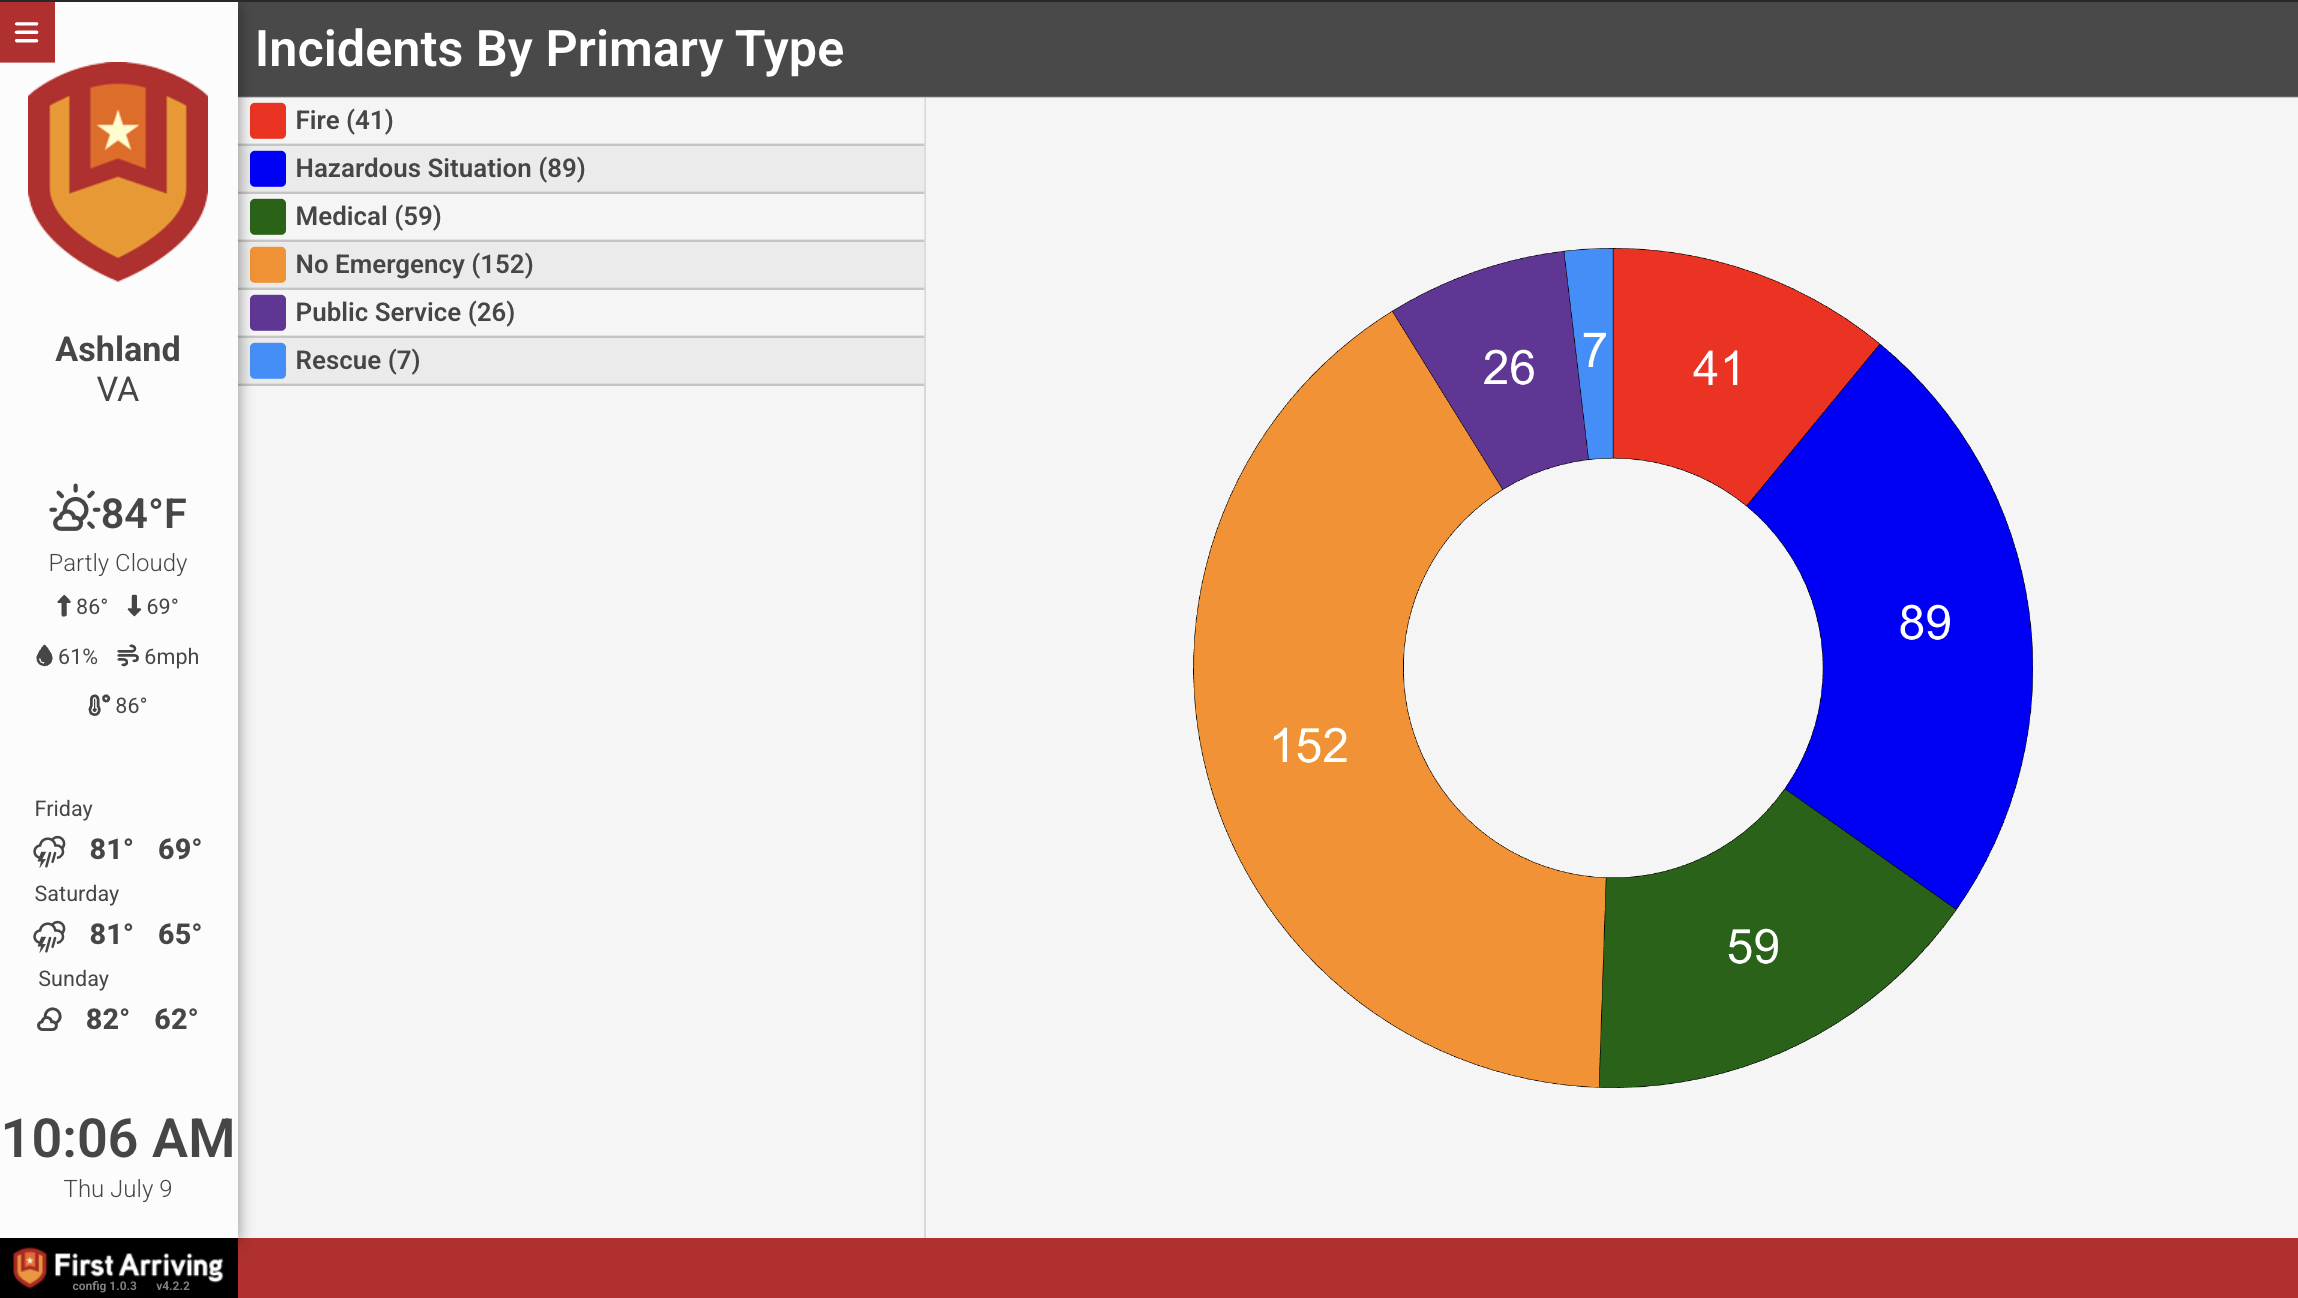
Incidents Chart as a doughnut, grouped by type.
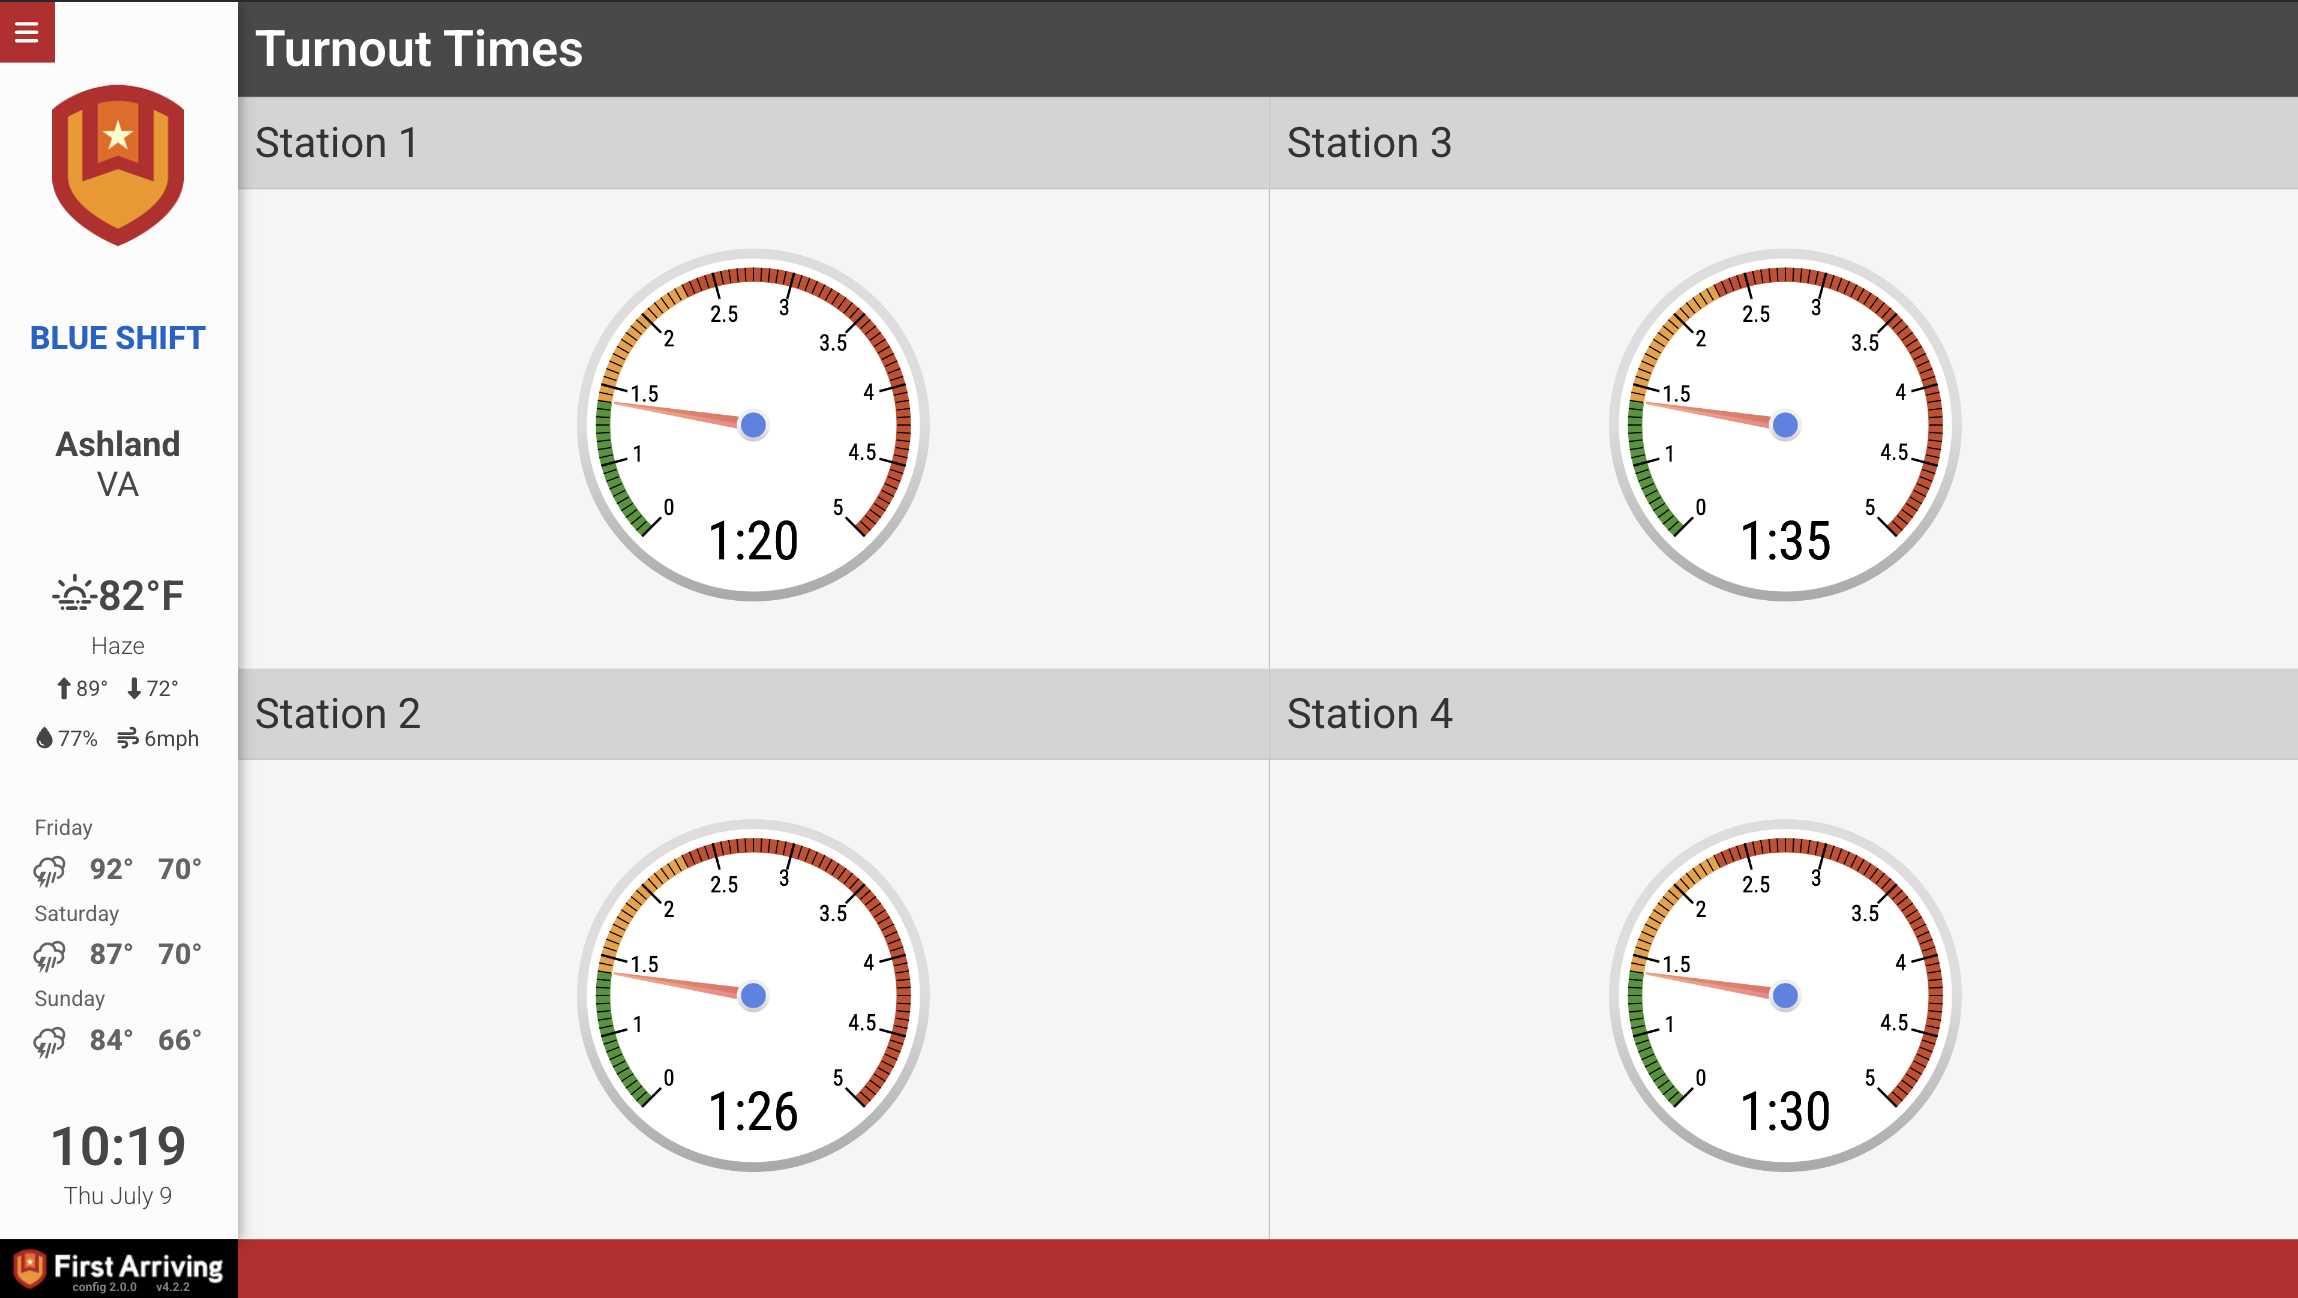
Turnout Gauges, one per station.
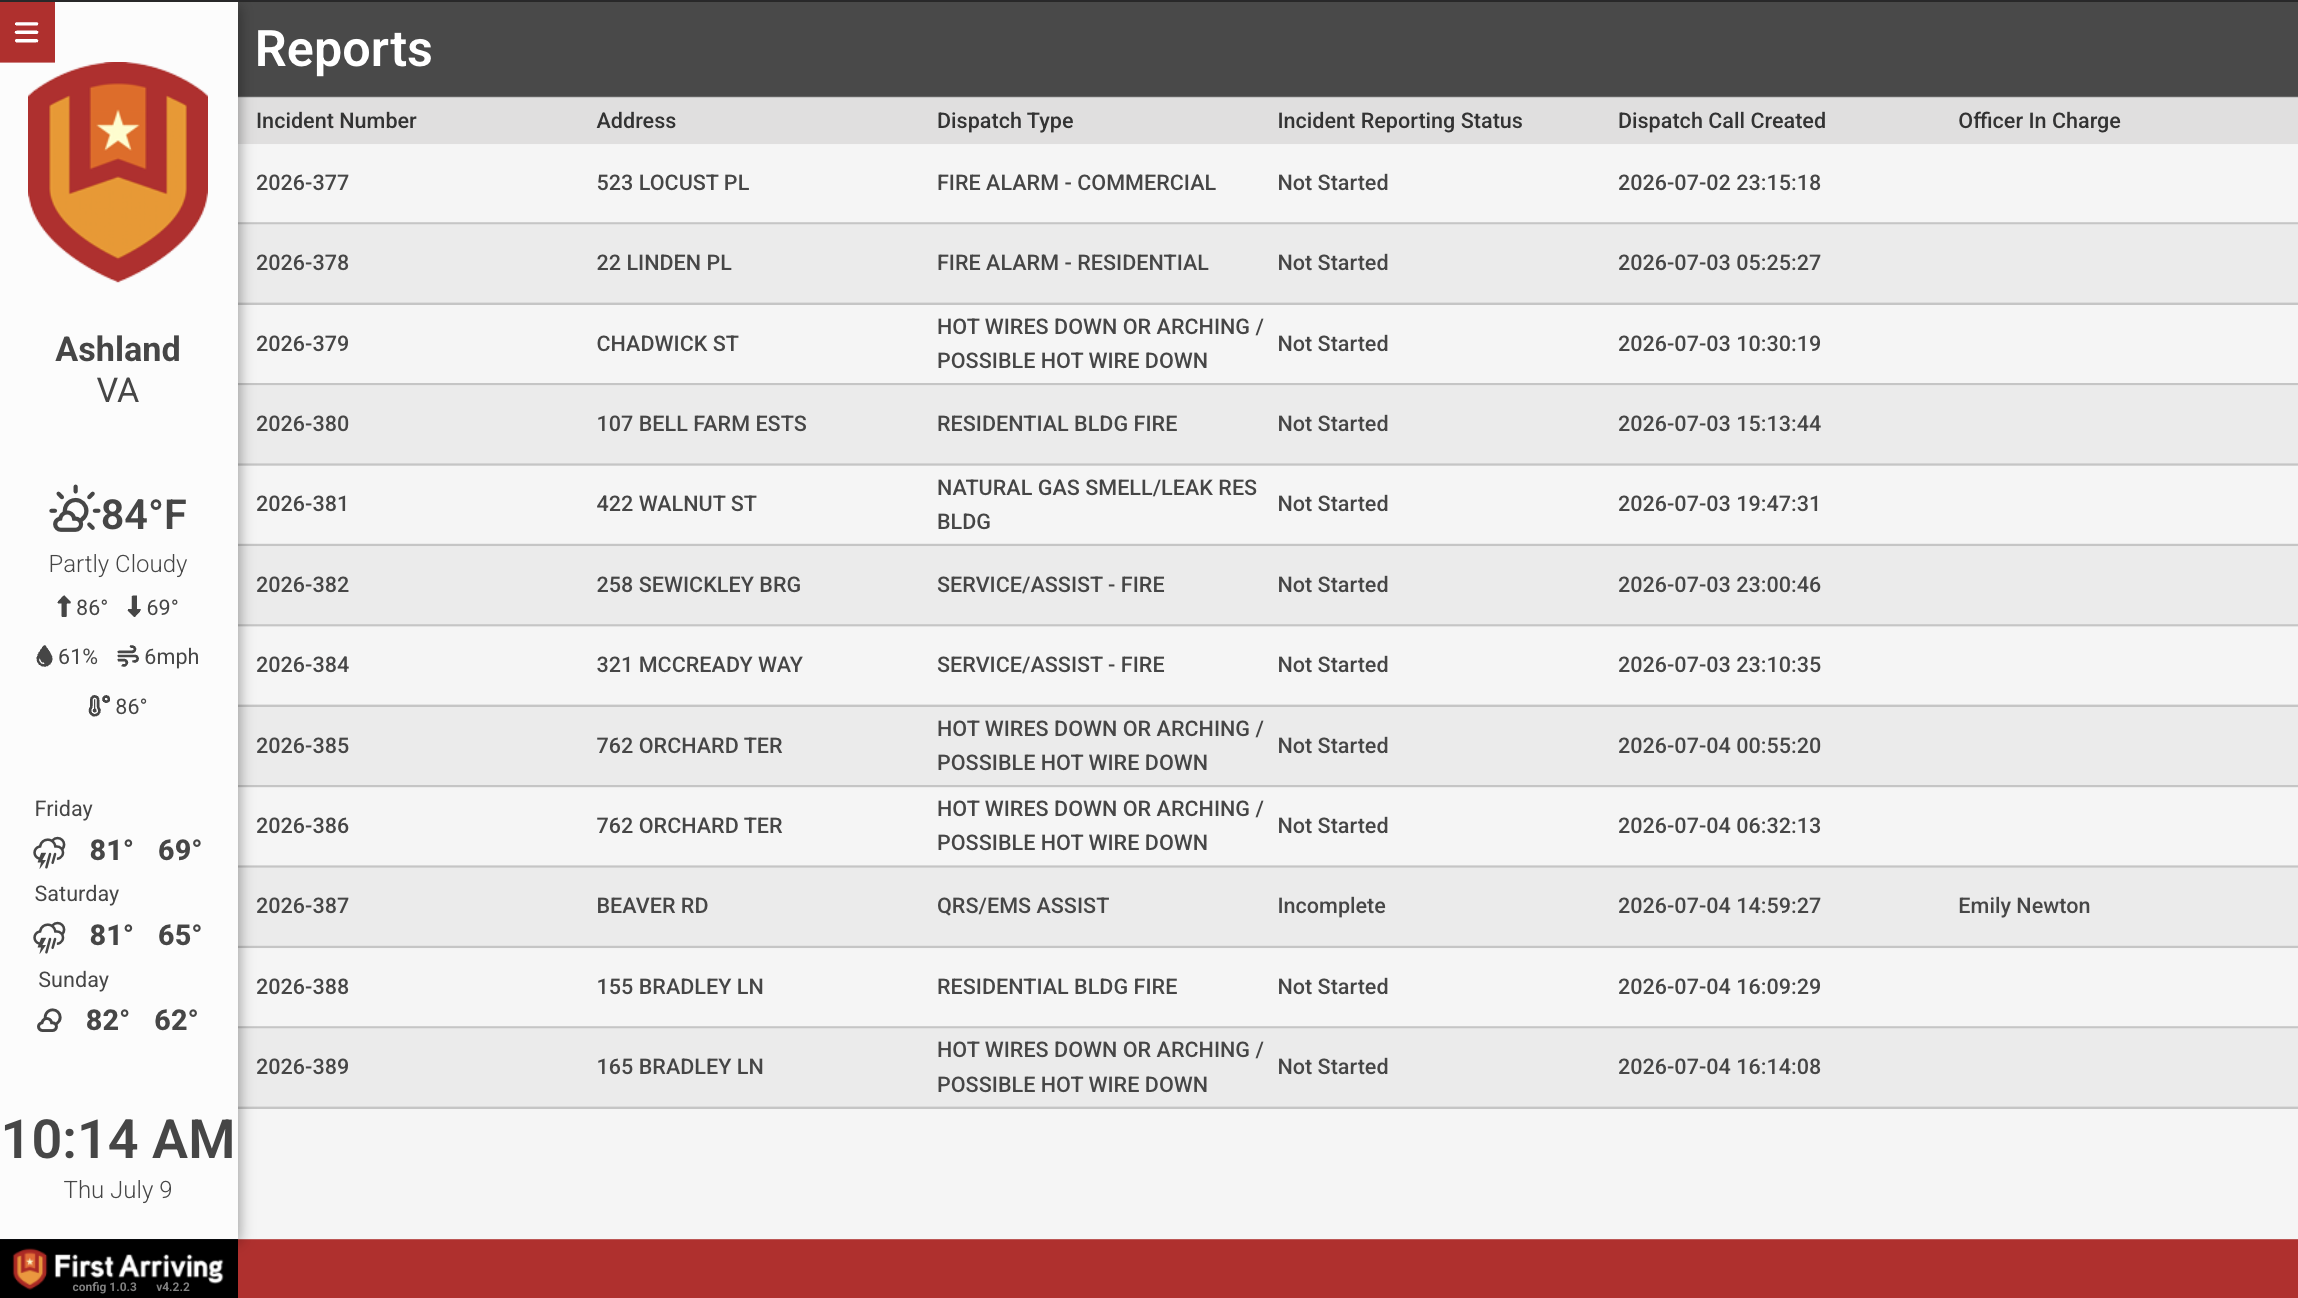
Incomplete Reports table.
What we need from you
One item: a subscription key generated inside your ESO Admin Console. Here’s how to get it to us.
Feature by feature
Every widget below is configured on its own. Two copies of the same widget can show completely different views — one station’s calls next to another’s, or emergent turnout beside non-emergent.
Tables
Call Counts
Total calls, grouped by the field you care about.
- Group by station, type, or unit
- Date range
- Incident description detail level
Calls by Type
Incident counts grouped by category or type.
- Group by category or type
- Date range
- Limit to specific shifts, with a configurable shift start time
- Limit to specific units
Turnout Times
Response-time performance by unit, broken out by shift.
- Choose the interval measured: turnout (en route), travel, arrival, on scene, or cleared
- Break out selected shifts as columns
- Compliance benchmark, in seconds
- Report the average or a chosen percentile, such as the 90th
- Filter by response mode: emergent or non-emergent
- Restrict to a time-of-day window, with start and end times in a set timezone
- Measure from dispatch or from call creation
- Date range
Incomplete Reports
Incidents with unfinished or missing NERIS reports — useful on an officer-facing screen.
- Look-back range
- Choose which columns to show: incident #, call nature, unit, shift, address, time
Past Incidents
Recent individual incidents, pulled directly from ESO NERIS.
- Date range, up to 365 days
- Which incident statuses to include
- Incident description detail level: short, medium, or full
- Choose and reorder columns: #, ID, units, address, zone, type, time, station, shift
- Group by a field, or show a flat list
Charts
Incidents Chart
Incident counts by type, visualized.
- Chart type: doughnut or bar
- Show the total count in the center, on doughnut charts
- Which incident statuses to include
- Date range
Call Counts Chart
Call counts by your chosen grouping, visualized.
- Group by station, type, or unit
- Chart type: doughnut or bar
- Show the total count in the center, on doughnut charts
- Filter to specific units
- Date range
Gauges
Turnout Gauge
A single response-time metric on a radial dial — the fastest way to keep a benchmark visible in the bay.
- Display the average time or the compliance percentage
- Choose the interval measured: turnout (en route), travel, arrival, on scene, or cleared
- Compliance benchmark, in seconds
- Report the average or a chosen percentile
- Filter by response mode: emergent or non-emergent
- Filter by shift
- Filter by units
- Restrict to a time-of-day window, with start and end times in a set timezone
- Date range
Maps
Recent Calls Map
Recent incidents plotted as pins across your response area.
- Date range, up to 30 days
- Number of incidents to plot
- Which incident statuses to include
- Incident description detail level
- Which details appear in each pin’s popup: incident #, title, type, address, time
Questions about setup, or want help deciding which widgets belong on which screen? Open a ticket at our support center or reach us at dashboards@firstarriving.com and we’ll walk through it with you.