
Integration Guide
NFORS
Put NFORS analytics on the screens in your stations, so unit utilization and turnout performance are visible to every position in the department rather than just the people who run reports.
What we can put on your dashboard
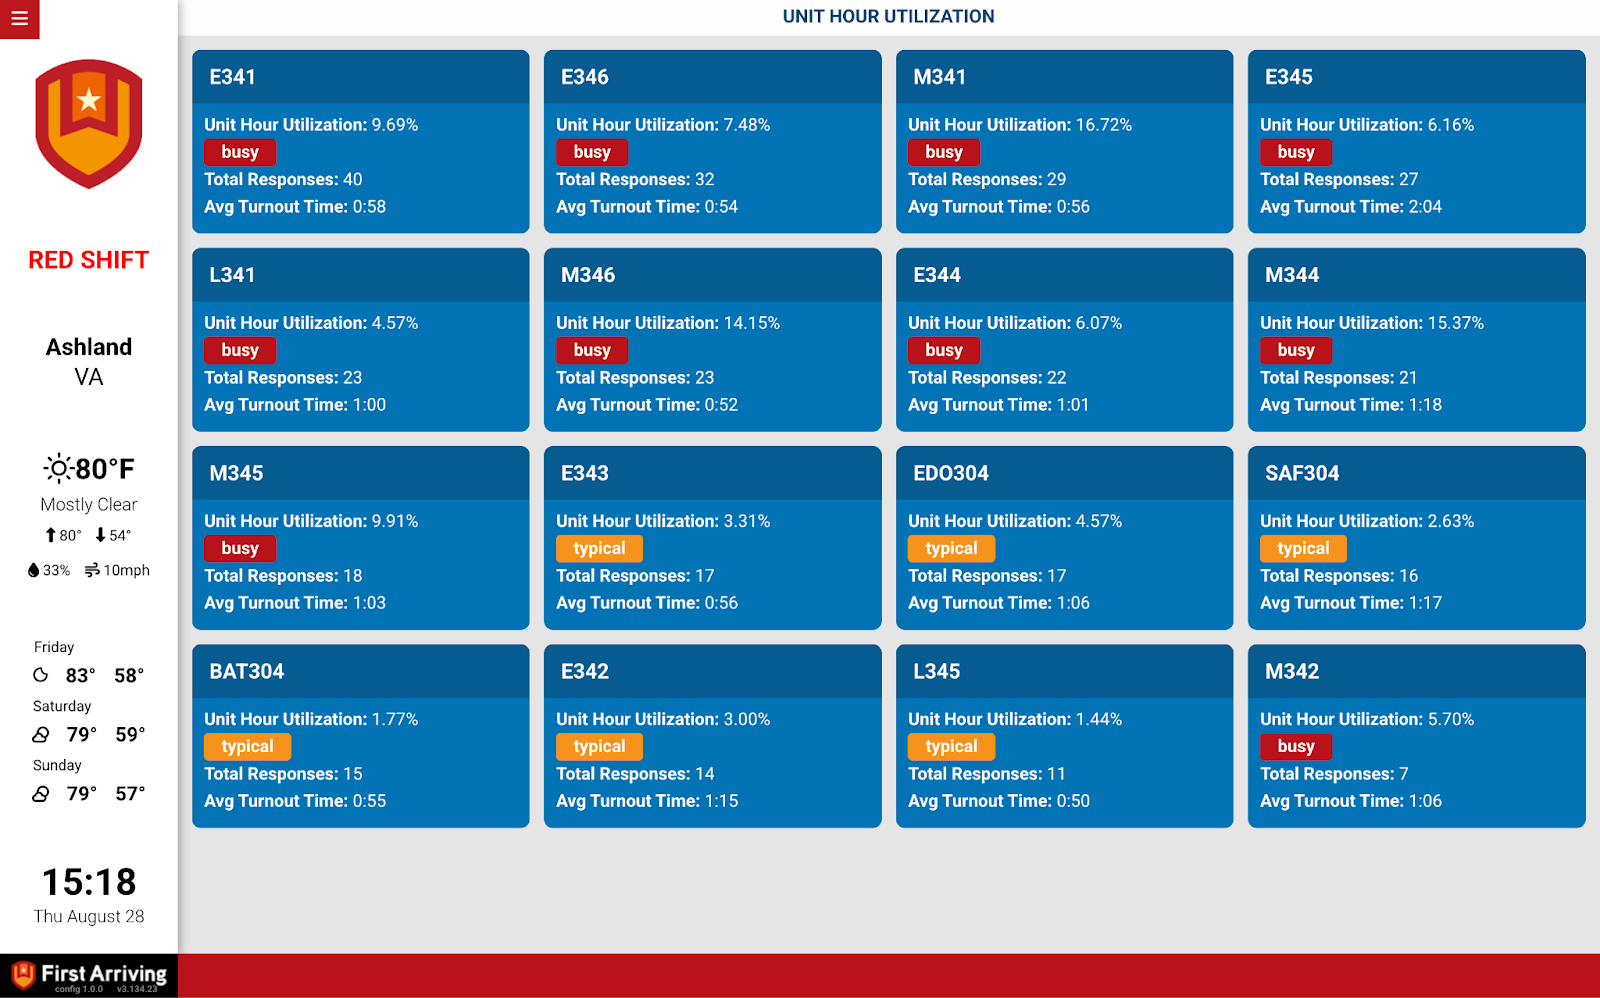
Unit utilization
Card-style, one per unit.
- Unit hour utilization as a percentage
- Typical, slow or busy indicator, color coded
- Total number of responses
- Time span customizable by day, week, month or year
- Fire and EMS counts
Average turnout time
Sortable by station, battalion and department.
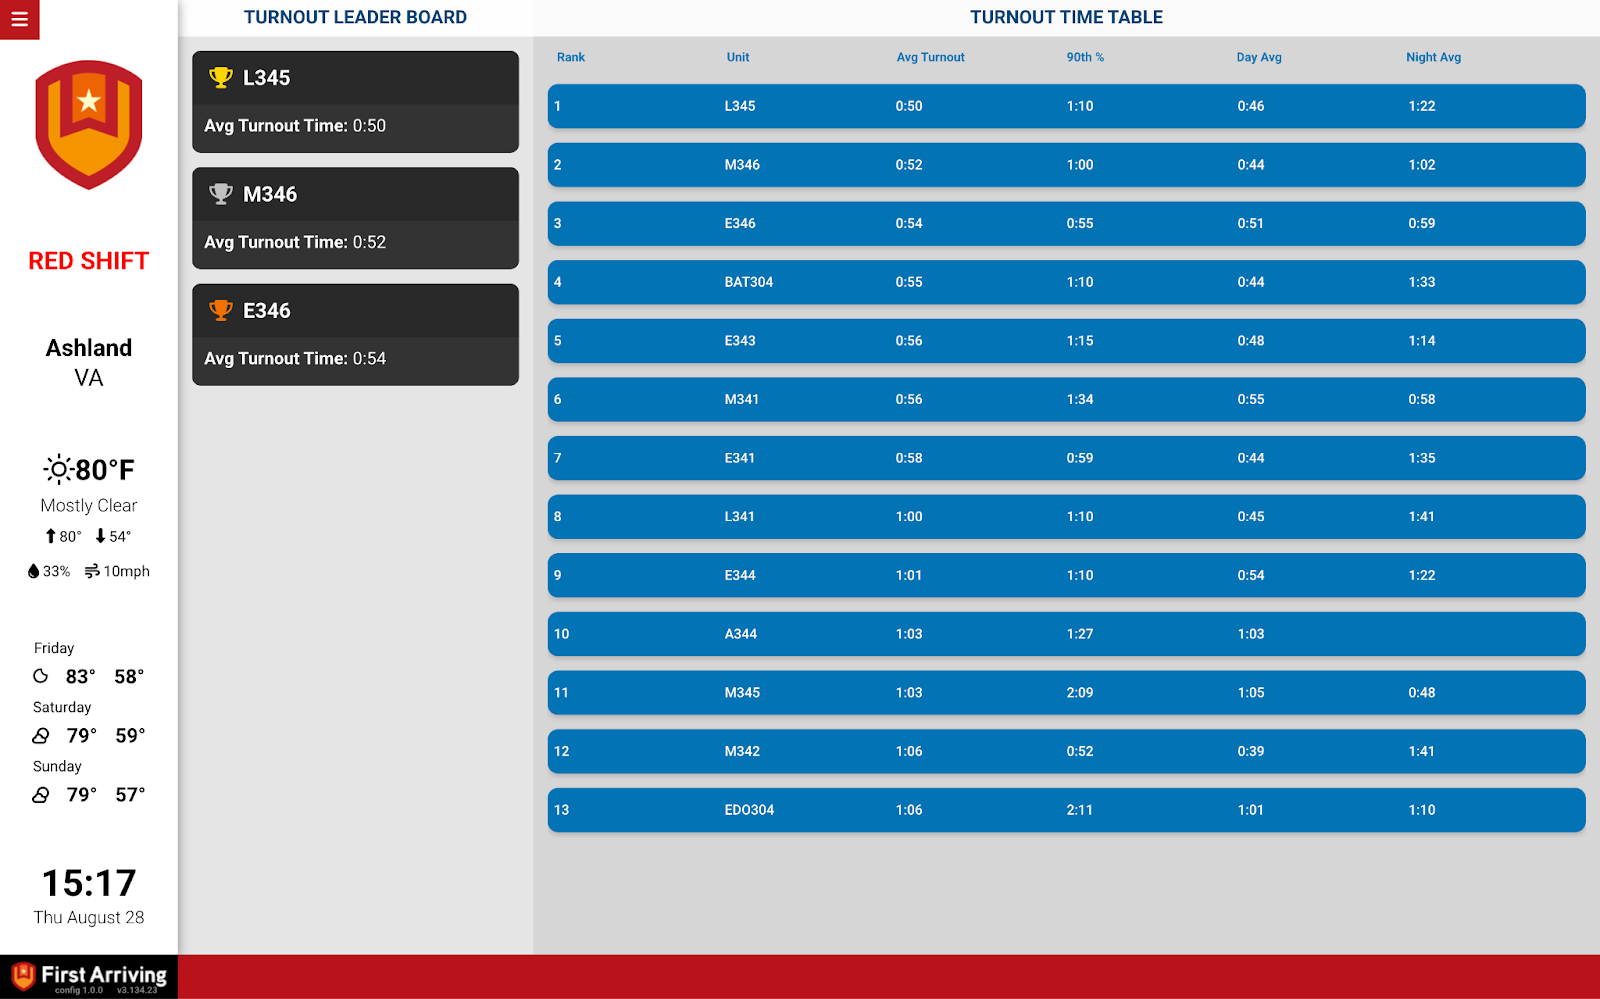
Top unit performers
First, second and third place by lowest turnout time, plus the department’s top ten in a table.
- Rank
- Unit
- Average turnout time in minutes and seconds
- Day turnout time
- Night turnout time
What we need from you
A username and password for the API. A non-admin account is fine — we only read.
Open a ticket at our support center first, then submit the credentials through the First Arriving Secrets Tool and paste the link it generates into your ticket. Please don’t send them by email or chat. Full instructions: Sending First Arriving sensitive information.
About vendor charges: data or API access could carry an additional charge, determined by NFORS and not by First Arriving.
Compatible views
Want a particular time span or sort order as the default? Open a ticket at our support center or reach us at dashboards@firstarriving.com.